Gap-and-Go vs. Gap-and-Trap Identification

The gap is supposed to fail. Often it just accelerates. Data at orb trading premarket smoothedgedesign shows that the distinction between momentum and reversal defines the edge in an opening range breakout scenario. Traders look for direction during the premarket, but the mechanical difference between a continuation and a trap dictates the risk profile for the session.
The Mechanics of Gap-and-Go
A Gap-and-Go occurs when the price moves aggressively away from the overnight session highs or lows immediately after the opening bell. This pattern requires high relative volume and a lack of immediate resistance at the opening range. The price does not stall. Instead, it maintains a directional bias that respects the initial impulse. In a Gap-and-Go, the first fifteen minutes establish a clear trend. The price stays above the high of the first five minute candle. Resistance is met with absorption, followed by immediate follow-through. A mechanical approach focuses on the slope of the move and the consolidation levels within the first hour of regular trading hours.
The Mechanics of Gap-and-Trap
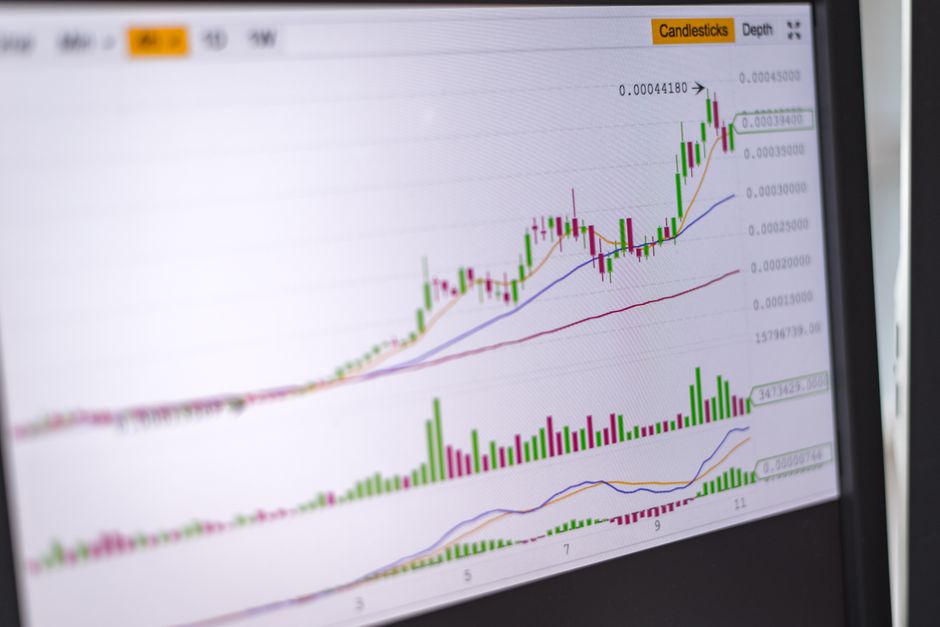
A Gap-and-Trap is a failed breakout. It looks like a momentum move, but the price hits a wall and reverses toward the previous day's close. This happens when the gap is filled quickly. The trap occurs when the price attempts to break the session high but fails to hold the level. Instead of a continuation, the tape shows aggressive selling or buying at the extremes. The move becomes a mean reversion play. Tracking the fifteen minute range helps identify when a move has lost its structural integrity. A trap is defined by the failure to hold the opening range levels.
Volume and Price Action Divergence
Volume provides the signal for which pattern is forming. In a Gap-and-Go, volume typically expands on the breakout moves and contracts during minor pullbacks. The price action stays synchronized with the volume profile. In a Gap-and-Trap, volume might spike on the initial breakout attempt, but the subsequent rejection shows heavy institutional selling. If the price breaks the thirty minute range with declining volume, the probability of a trap increases. The lack of participation at the new highs suggests the move lacks the fuel to continue.
Timeframe Coordination
Execution depends on the selected timeframe. A 5 minute chart provides the entry trigger, while the 15 minute chart provides the structural context. If the 60 minute range shows a heavy supply zone just above the gap, the Gap-and-Go is unlikely to persist. The interplay between the intraday trend and the overnight session levels determines the target. A trader monitors the session high to see if it acts as support or a ceiling. The distinction is found in the speed of the reaction at the break point.